Comparing the performance of hk and Lefthook
Recently hk, a tool for running Git hooks (pre-commit, pre-push) was announced. Lefthook is an existing alternative. In hk’s documentation it’s mentioned this way:
lefthook is written in go, hk is written in rust. This will make hk faster but the advanced parallelism logic in hk should make hk much faster. Because git hook managers are often limited not by their own logic but the speed of the commands they run, this should make hk signficantly faster in real-world usage.
In my experience, the choice between Rust or Go wouldn’t make a big difference for a tool of this kind. Both languages have quick start-up time and I don’t see how the better optimizer in LLVM would help here. However, hk does have benchmarks which shows that it’s much faster than Lefthook. Let’s dive in and try to understand what’s going on here! I’m not interested in declaring a "winner", but I am interested in understanding the different techniques these tools are using.
For those who are busy and don’t want to read the article, the main conclusions are:
-
Lefthook hasn’t been heavily optimized and after profiling I found able to make it faster or on par with hk for all of its benchmarks. This required only 2 files changed, 56 insertions(+), 41 deletions(-) to Lefthook.
-
hk uses Pkl for its configuration and evaluates this by spawning a separate Kotlin process. This adds ~20 ms of latency on my computer. If hk wants to become the faster tool by far they should consider changing the way they’re loading configuration.
-
The biggest difference between hk and Lefthook is that Lefthook spawns the
gitcommand-line tool while hk uses libgit2, which is way quicker. Lefthook can probably become even faster if they link with libgit2. -
The "advanced parallelism logic" of hk doesn’t appear to be relevant for its performance in this benchmark. It is however a neat technique for easily running commands in parallel without requiring the user to annotate them with parallelism groups.
Running the benchmarks
Let’s first reproduce the benchmarks:
# Clone and build Lefthook:
(
  git clone https://github.com/evilmartians/lefthook
    # commit cloned: 6ad8b5227fb9993fa17c1289e8c87d7b166bb78c
  cd lefthook
  go build .
)

# Clone the `hk` repo:
git clone https://github.com/jdx/hk
  # commit cloned: a5bfbe835a39eeafa230f28df52513fad67af774
cd hk
cargo build --profile serious

# Install Actionlint and Prettier
nix build nixpkgs#actionlint -o attic/actionlint
nix build nixpkgs#nodePackages.prettier -o attic/prettier
export PATH="attic/actionlint/bin:attic/prettier/bin:$PATH"
We can now run two different commands to compare these two tools:
-
time ../lefthook/lefthook -
time ./target/serious/hk
I’m going to run them (on a MacBook Pro M3) manually a few times and take the most common value. I would interpret all of these with an uncertainty of +- 5 ms, if not even more. I believe this represents a fair comparison between these two tools. You should this yourself if you’re in doubt.
| Use case | hk | Lefthook |
|---|---|---|
No changes |
52 ms |
70 ms |
Unstaged |
52 ms |
70 ms |
Staged |
95 ms |
155 ms |
All files |
180 ms |
200 ms |
A few thoughts:
-
The "No changes" and "Unstaged" example is the exact same: Both tools end up checking what changes has been staged and then discover that nothing needs to be done (since none of the staged changes matches any of the globs).
-
Neither the "No changes" nor "Unstaged" is something that would actually happen. A pre-commit hook would only fire before a commit and you can’t commit anything if you haven’t staged anything.
-
The "Staged" test is staging a change in
src/main.rswhich causes two jobs to execute:cargo fmtand a Ripgrep command looking fordbgstatements. For both tools these are executed in parallel and we’re limited bycargo fmt. Runningcargo fmtdirectly takes ~70 ms. -
The overall theme here seems to be that hk is 20 ms faster than Lefthook at executing the hooks. It will be up to you to decide if this matters or not.
-
However, something is going on in the "Staged" scenario where Lefthook is suddenly way slower.
Side note: One time I ran hk in the "Staged" scenario and it gave me the following error (but my working directory was still fine):
$ time ./target/serious/hk run pre-commit
mise cargo-fmt ✓ done
mise dbg      ✓ done
Error:   × failed to apply diff
  ╰─▶ hunk at line 36 did not apply; class=Patch (31); code=ApplyFail (-35)

./target/serious/hk run pre-commit  0.06s user 0.04s system 81% cpu 0.122 total
Exploring Lefthook
Profiling with a flame graph
Why is Lefthook slower than hk? It’s time to profile!
We first apply this patch:
diff --git i/cmd/lefthook.go w/cmd/lefthook.go
index b31b674..a85cb15 100644
--- i/cmd/lefthook.go
+++ w/cmd/lefthook.go
@@ -1,8 +1,31 @@
 package cmd

-import "github.com/evilmartians/lefthook/internal/log"
+import (
+	"os"
+	"runtime"
+	"runtime/pprof"
+
+	"github.com/evilmartians/lefthook/internal/log"
+)

 func Lefthook() int {
+	if filename := os.Getenv("CPUPROFILE"); filename != "" {
+		// Create a CPU profile file
+		f, err := os.Create(filename)
+		if err != nil {
+			panic(err)
+		}
+		defer f.Close()
+
+		runtime.SetCPUProfileRate(10000)
+
+		// Start profiling
+		if err := pprof.StartCPUProfile(f); err != nil {
+			panic(err)
+		}
+		defer pprof.StopCPUProfile() // Flushes data to file on exit
+	}
+
 	rootCmd := newRootCmd()

 	if err := rootCmd.Execute(); err != nil {
Then we run it and view the flamegraph:
# Run the command with profiling:
CPUPROFILE="attic/cpu.pprof" ../lefthook/lefthook run pre-commit

# Open it: View -> Flame Graph
go tool pprof -http=:8080 attic/cpu.pprof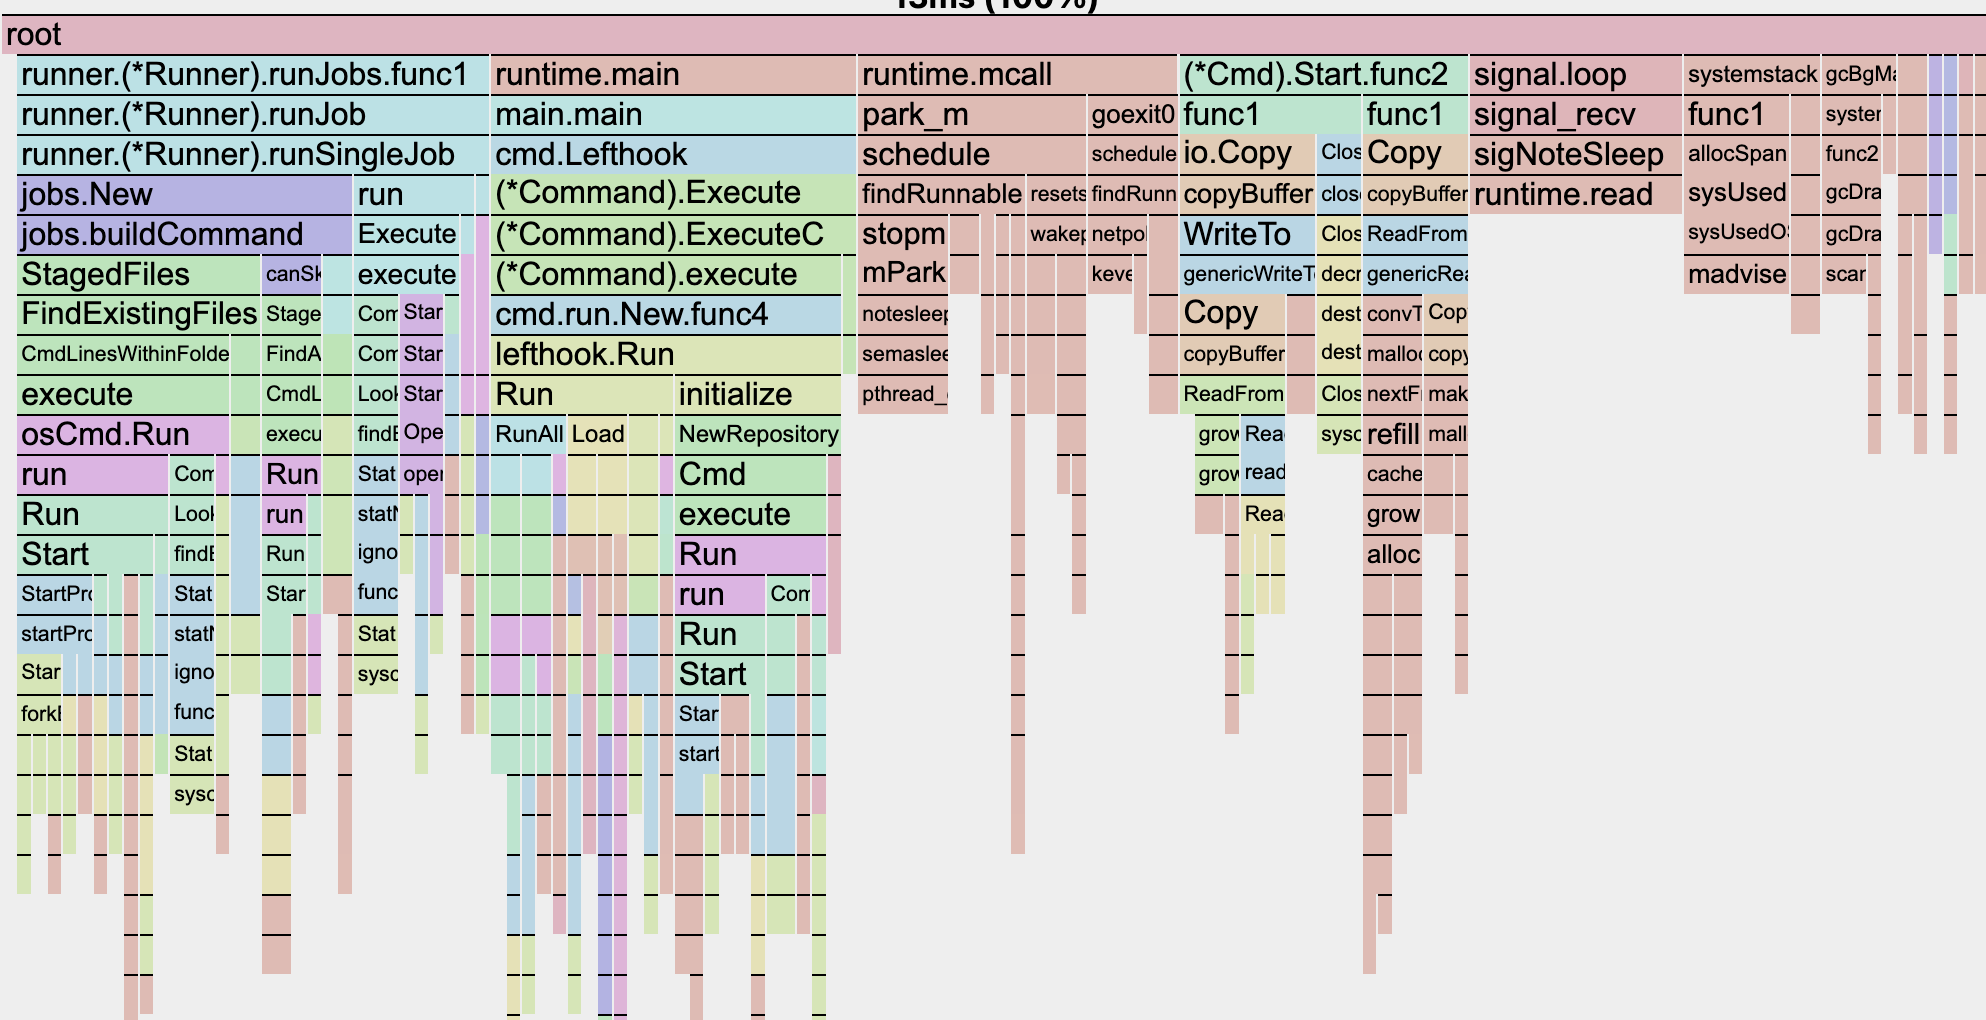
We’ll find some interesting things here:
-
lefthook.initializetakes quite a long time. This is done regardless of anything relevant to the specific scenario. -
FindExistingFilesis also quite slow. -
We see that
system.osCmd.Runappears quite often. This is whenever we’re spawning another process. -
The cases where
scheduleis top of the flamegraph is probably when we don’t have anything to do, but rather is waiting forcargo fmtto finish.
Understanding what we’re spawning
Let’s dive more in into those processes we’re spawning. Profilers tend to impact the behavior of the program quite a lot so for these fine-grained cases I prefer the simplest possible measurement:
diff --git i/internal/git/command_executor.go w/internal/git/command_executor.go
index cd4174a..592898c 100644
--- i/internal/git/command_executor.go
+++ w/internal/git/command_executor.go
@@ -5,6 +5,7 @@ import (
        "fmt"
        "path/filepath"
        "strings"
+       "time"

        "github.com/evilmartians/lefthook/internal/log"
        "github.com/evilmartians/lefthook/internal/system"
@@ -73,7 +74,9 @@ func (c CommandExecutor) CmdLinesWithinFolder(cmd []string, folder string) ([]st
 func (c CommandExecutor) execute(cmd []string, root string) (string, error) {
        out := new(bytes.Buffer)
        errOut := new(bytes.Buffer)
+       n := time.Now()
        err := c.cmd.Run(cmd, root, system.NullReader, out, errOut)
+       fmt.Printf("executed %s in %s\n", strings.Join(cmd, " "), time.Since(n))
        outString := out.String()

        log.Debug("[lefthook] stdout: ", outString)
This gives the following output (mangled together with regular output):
executed git version in 4.937916ms
executed git rev-parse --path-format=absolute --show-toplevel in 4.538333ms
executed git rev-parse --path-format=absolute --git-path hooks in 3.65025ms
executed git rev-parse --path-format=absolute --git-path info in 3.980542ms
executed git rev-parse --path-format=absolute --git-dir in 3.843125ms
executed git hash-object -t tree /dev/null in 4.079125ms
executed git status --short --porcelain in 7.912875ms
executed git diff --name-only --cached --diff-filter=ACMR in 5.65375ms
executed git diff --name-only --cached --diff-filter=ACMR in 5.734625ms
executed git diff --name-only --cached --diff-filter=ACMRD in 5.891584ms
executed git diff --name-only --cached --diff-filter=ACMR in 6.839333ms
executed git diff --name-only --cached --diff-filter=ACMR in 7.227209ms
executed git stash list in 4.5445ms
Wow, this gave us quite a lot of information!
-
We run four
rev-parsecommands sequentially, each taking ~4 ms. -
We call
git hash-object -t tree /dev/nulleven though this actually is a constant value. If it ever changes from4b825dc642cb6eb9a060e54bf8d69288fbee4904I think we’re in trouble. -
One variant of
git diffis called four times. This seems to be once per job. They all try to determine the staged files and it seems to be completely unnecessary duplication. -
We’re also calling
git diffin an additional variant (--diff-filter=ACMRD). -
There’s another call to
git status --short --porcelain. Looking through the code this appears because it tries to determine if there are partially staged files (which it needs to stash). -
And finally there’s a call to
git stash list.
Speeding up Lefthook
Based on the analysis done in the previous section there were three immediate improvements I could think of:
-
git rev-parseactually supports asking for multiple things in the same command. Those four calls can be reduced to a single one. -
The
git statusandgit diffcommands can (1) be done initially in the background and soon as possible, and (2) be cached so we only invoke them once. -
When we’re detecting that we don’t have partially staged files there’s no need to execute the unstash. This avoids the last call to
git stash list.
Here’s the summary of the changes which I’ve opened a PR for.
$ git diff master --stat
 internal/git/repository.go         | 91 ++++++++++++++++++++++++-------------------
 internal/lefthook/runner/runner.go |  6 ++-
 2 files changed, 56 insertions(+), 41 deletions(-)
Let’s run the benchmarks again:
| Use case | hk | Lefthook (improved) |
|---|---|---|
Unstaged |
52 ms |
42 ms |
Staged |
95 ms |
90 ms |
All files |
180 ms |
180 ms |
And it turns out that we’re faster than hk. Hopefully all my changes are correct.
Exploring hk
What’s up with Pkl?
The first time I built and ran it I got the following error message:
$ cargo build && ./target/debug/hk run --verbose pre-commit
   Compiling hk v0.2.2
    Finished `dev` profile [unoptimized + debuginfo] target(s) in 1.00s
Error:   × unknown error
This turned out to be caused by me not having the pkl command-line tools installed.
I reported it as a bug and now it gives a better error message.
However, this lead me to realize that hk is actually spawning another program solely for reading its configuration.
And not only that: pkl is implemented in Kotlin, typically compiled to a native binary through GraalVM.
How long will this take?
diff --git i/src/cli/run/pre_commit.rs w/src/cli/run/pre_commit.rs
index 7def3b6..73e82ca 100644
--- i/src/cli/run/pre_commit.rs
+++ w/src/cli/run/pre_commit.rs
@@ -1,6 +1,8 @@
 use crate::{config::Config, env, step::RunType};
 use crate::{git::Git, Result};

+use std::time::{Instant};
+
 /// Sets up git hooks to run hk
 #[derive(Debug, clap::Args)]
 #[clap(visible_alias = "co")]
@@ -22,7 +24,9 @@ pub struct PreCommit {

 impl PreCommit {
     pub async fn run(&self) -> Result<()> {
+        let now = Instant::now();
         let config = Config::get()?;
+        println!("loading config: {:?}", now.elapsed());
         let mut repo = Git::new()?;
         let run_type = if self.all {
             if !self.check && (self.fix || *env::HK_FIX) {
Aaaaand:
$ time ./target/serious/hk run pre-commit
loading config: 23.256417ms
…
Oh. That’s 20 ms spent for a program which works in the order of ~100 ms. That’s … a lot. Turns out that being written in Rust doesn’t help when your spawning Kotlin programs behind the scenes.
What’s the advanced parallelism logic?
This benchmark here is rather boring from a parallelism perspective: Every task can be run in parallel and there’s very few tricks. However, I’m interesting in understanding how hk works. It doesn’t appear to have any manual paralleism annotations such as Lefthook.
(A few minutes later.)
The main logic appears to be in the step_scheduler.rs, and it’s quite a smart way of executing the steps:
-
hk separate steps into "check" or "fix", where checks are not allowed to modify the files. This essentially corresponds to "read" or "write".
-
It maintains a read/write-lock per staged file.
-
Every step is started in parallel together, but each step takes out the relevant locks filtered down by the "glob" rules before executing the command. A check step takes out a read-lock while a fix step takes out a write-lock.
-
This guarantees that, without any annotations, you get the maximum parallelism while ensuring that two fix steps won’t execute in parallel on the same file.
It seems like a very sensible approach which I hope Lefthook will adopt it. It’s a lot easier for an end user to mark steps as "check" or "fix" compared to the correct parallelism annotation.
However, I’m not sure if it’s that useful. My pre-commit commands have typically been quite few and 9 out of 10 times I can just run everything in parallel.
In the end, hk will probably be faster – but not because of Rust
A common conclusion when someone is reimplementing tool X in language Y is that towards the end they will say something like:
Look, my new version is faster than X! This shows the language Y is far superior!
However, by definition the new version will be faster: They kept tweaking and improving their version until it became faster than the original version. If they didn’t manage to make any improvements they wouldn’t bother showing it to the world.
I suspect that in the end hk probably will become faster than Lefthook.